OpenBUGS (Thomas, n.d.) is an open source software for analysing complex statistical models using Markov chain Monte Carlo (MCMC) methods. BUGS stands for Bayesian inference Using Gibbs Sampling. The OpenBUGS software is freely available at http://www.openbugs.net/w/FrontPage. OpenBUGS is based on WinBUGS (Lunn et al., 2000): a fundamental difference between the two versions is the license. FSK-Lab facilitates the usage of OpenBUGS through the R package R2OpenBUGS (Sturtz et al., 2020). R models in FSK-Lab can make use of BUGS files as long as they are stored in plaintext files zz(.txt).
Example
In the following there is a minimal example of how to include OpenBUGS into an R model created with FSK-Lab. The example is taken from the R2OpenBUGS vignettes (Sturtz et al., 2020).
OpenBUGS model: schools.txt
This is the OpenBUGS-code, which is the basis for the MCMC simulation that estimates theta, mu.theta and sigma.theta (copied from (Sturtz et al., 2020), p. 6). It should be saved as txt-file, e.g. school.txt.
model {
  for (j in 1:J)
  {
    y[j] ~ dnorm (theta[j], tau.y[j])
    theta[j] ~ dnorm (mu.theta, tau.theta)
    tau.y[j] <- pow(sigma.y[j], -2)
  }
  mu.theta ~ dnorm (0.0, 1.0E-6)
  tau.theta <- pow(sigma.theta, -2)
  sigma.theta ~ dunif (0, 1000)
}
Parameters
The MCMC simulation requires two input parameters (both have to be entered in the model metadata in the metadata.xlsx-file). n_chains and n_iter specify the number of chains and number of iterations of the MCMC simulation.

Model script: model.R
To create an FSKX-model, the before mentiones bugs-model needs to be included into a full R model script. The model script (1) loads the R2OpenBUGS package, (2) loads the data of the dataset “schools”, (3) prepares the data inputs for the bugs-functions, and (4) runs a MCMC simulation using the bugs-function to get estimates for theta, mu.theta and sigma.theta. The parameter schools.sim contains the results of the MCMC simulation.
library(R2OpenBUGS)
data(schools)

J <- nrow(schools)
y <- schools$estimate
sigma.y <- schools$sd
data <- list("J", "y", "sigma.y")

inits <- function() {
  list(theta = rnorm(J, 0, 100),
       mu.theta = rnorm(1, 0, 100),
       sigma.theta = runif(1, 0, 100))
}

schools.sim <- bugs(data, inits,
                    model.file = "schools.txt",
                    parameters = c("theta", "mu.theta", "sigma.theta"),
                    n.chains = 3, n.iter = 1000)
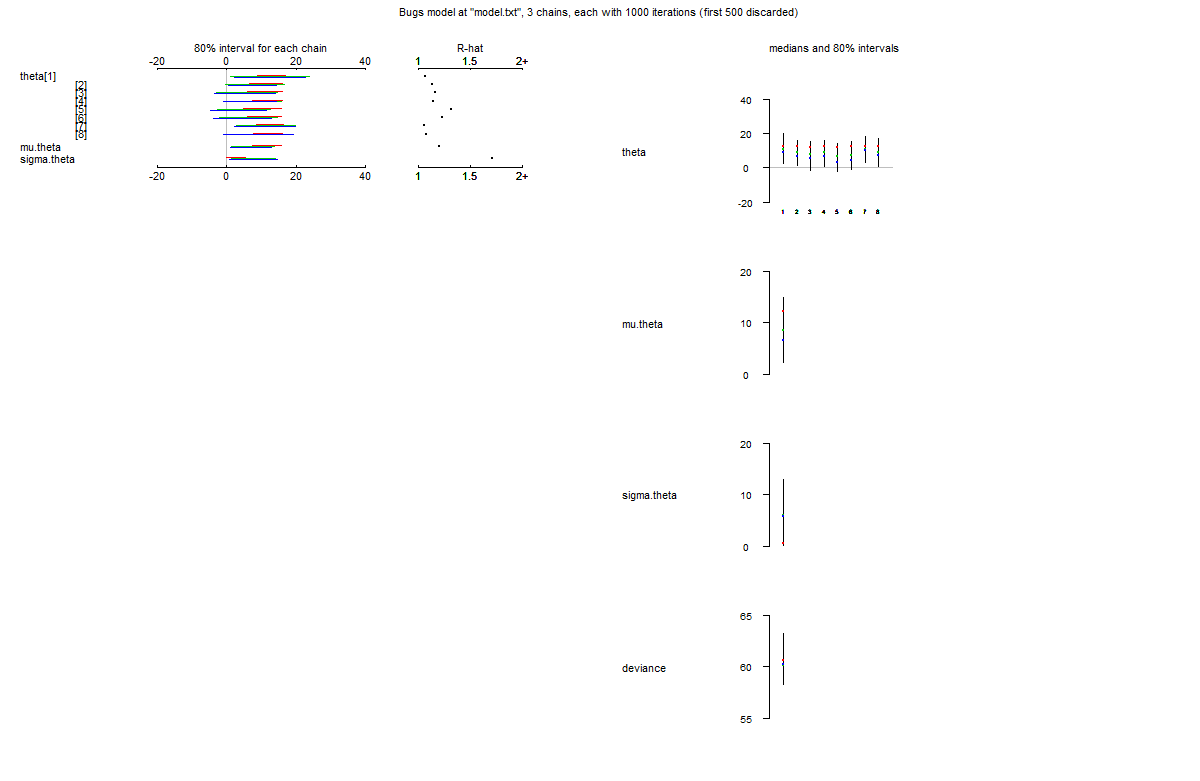
Visualization script: visualization.R
The visualization script is pretty straightforward and produces the following plot.
plot(schools.sim)
References
- Thomas, A. OpenBUGS. http://www.openbugs.net/w/FrontPage
- Lunn, D. J., Thomas, A., Best, N., & Spiegelhalter, D. (2000). WinBUGS \–A Bayesian modelling framework: Concepts, structure, and extensibility. Statistics and Computing, 10(4), 325–337. https://doi.org/http://dx.doi.org/10.1023/A:1008929526011
- Sturtz, S., Statistik, F., Ligges, U., Statistik, F., & Gelman, A. (2020). R2OpenBUGS: A Package for Running OpenBUGS from R. https://cran.rstudio.com/web/packages/R2OpenBUGS/R2OpenBUGS.pdf
- Sturtz, S., Statistik, F., Ligges, U., Statistik, F., & Gelman, A. (2020). R2OpenBUGS: A Package for Running OpenBUGS from R. https://cran.rstudio.com/web/packages/R2OpenBUGS/vignettes/R2OpenBUGS.pdf