Introduction
FSK-Lab does not support every R package for plotting or creating graphics. This page lists the supported pages and working examples.
Supported R plots

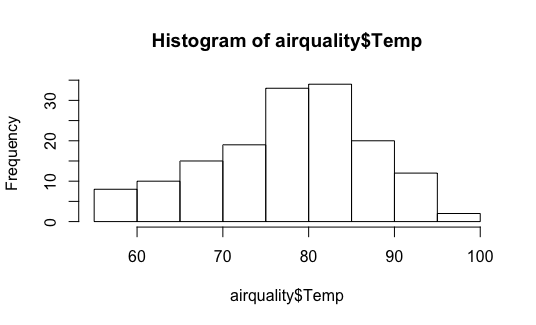
R Base plots
Graphics generated with R Base. They include histograms, line graphs, scatterplots and boxplots. See more at R graphics package.
Example:
hist(airquality$Temp)
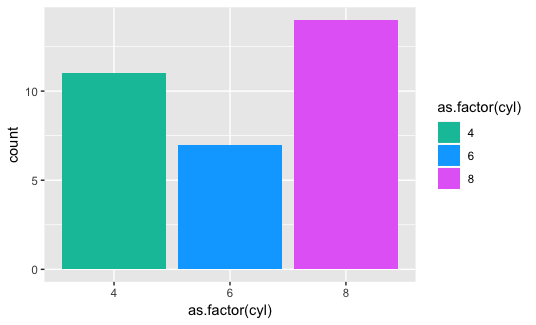
ggplot2 plots
ggplot2 is a system for declaratively creating graphics, based on The Grammar of Graphics. You provide the data, tell ggplot2 how to map variables to aesthetics, what graphical primitives to use, and it takes care of the details. See more at the ggplot2 site.
Example:
library(ggplot2)
ggplot(mtcars, aes(x=as.factor(cyl), fill=as.factor(cyl) )) +
  geom_bar( ) +
  scale_fill_hue(h = c(180, 300))